
POLI 380 is an introduction to quantitative research methods that are employed in the field of political science and market research. We were introduced to the concepts and techniques of data analysis. Topics include summary measures, graphing and visual displays of distributions, probability and statistical inference, bivariate, and multiple regression. The course involved practical work with real-world data using the Stata software package. The objective of this course was to help students learn to evaluate quantitative data and to do fundamental statistical analysis.

My final project answered a simple question: In Canada, are Apple users more politically left of center than Windows and Android users? I was able to answer this question in my report, using the 2015 Canadian Election Study data set.
In my first iteration of my report using multivariate regression analysis, I was able to answer that based on the results of the report: Apple owners in Canada are in fact more politically left of center than Windows or Android owners. What I discovered after controlling for age and income, the report observed a slight increase for Canadians being left of center if they are an Apple owner. The data was statistically significant with a threshold is less than 10%, This means that the report would only expect a result this strong or stronger in less than 10% of samples if there was truly no relationship between Apple owners and being politically left of center. The findings are cautiously interpreted.
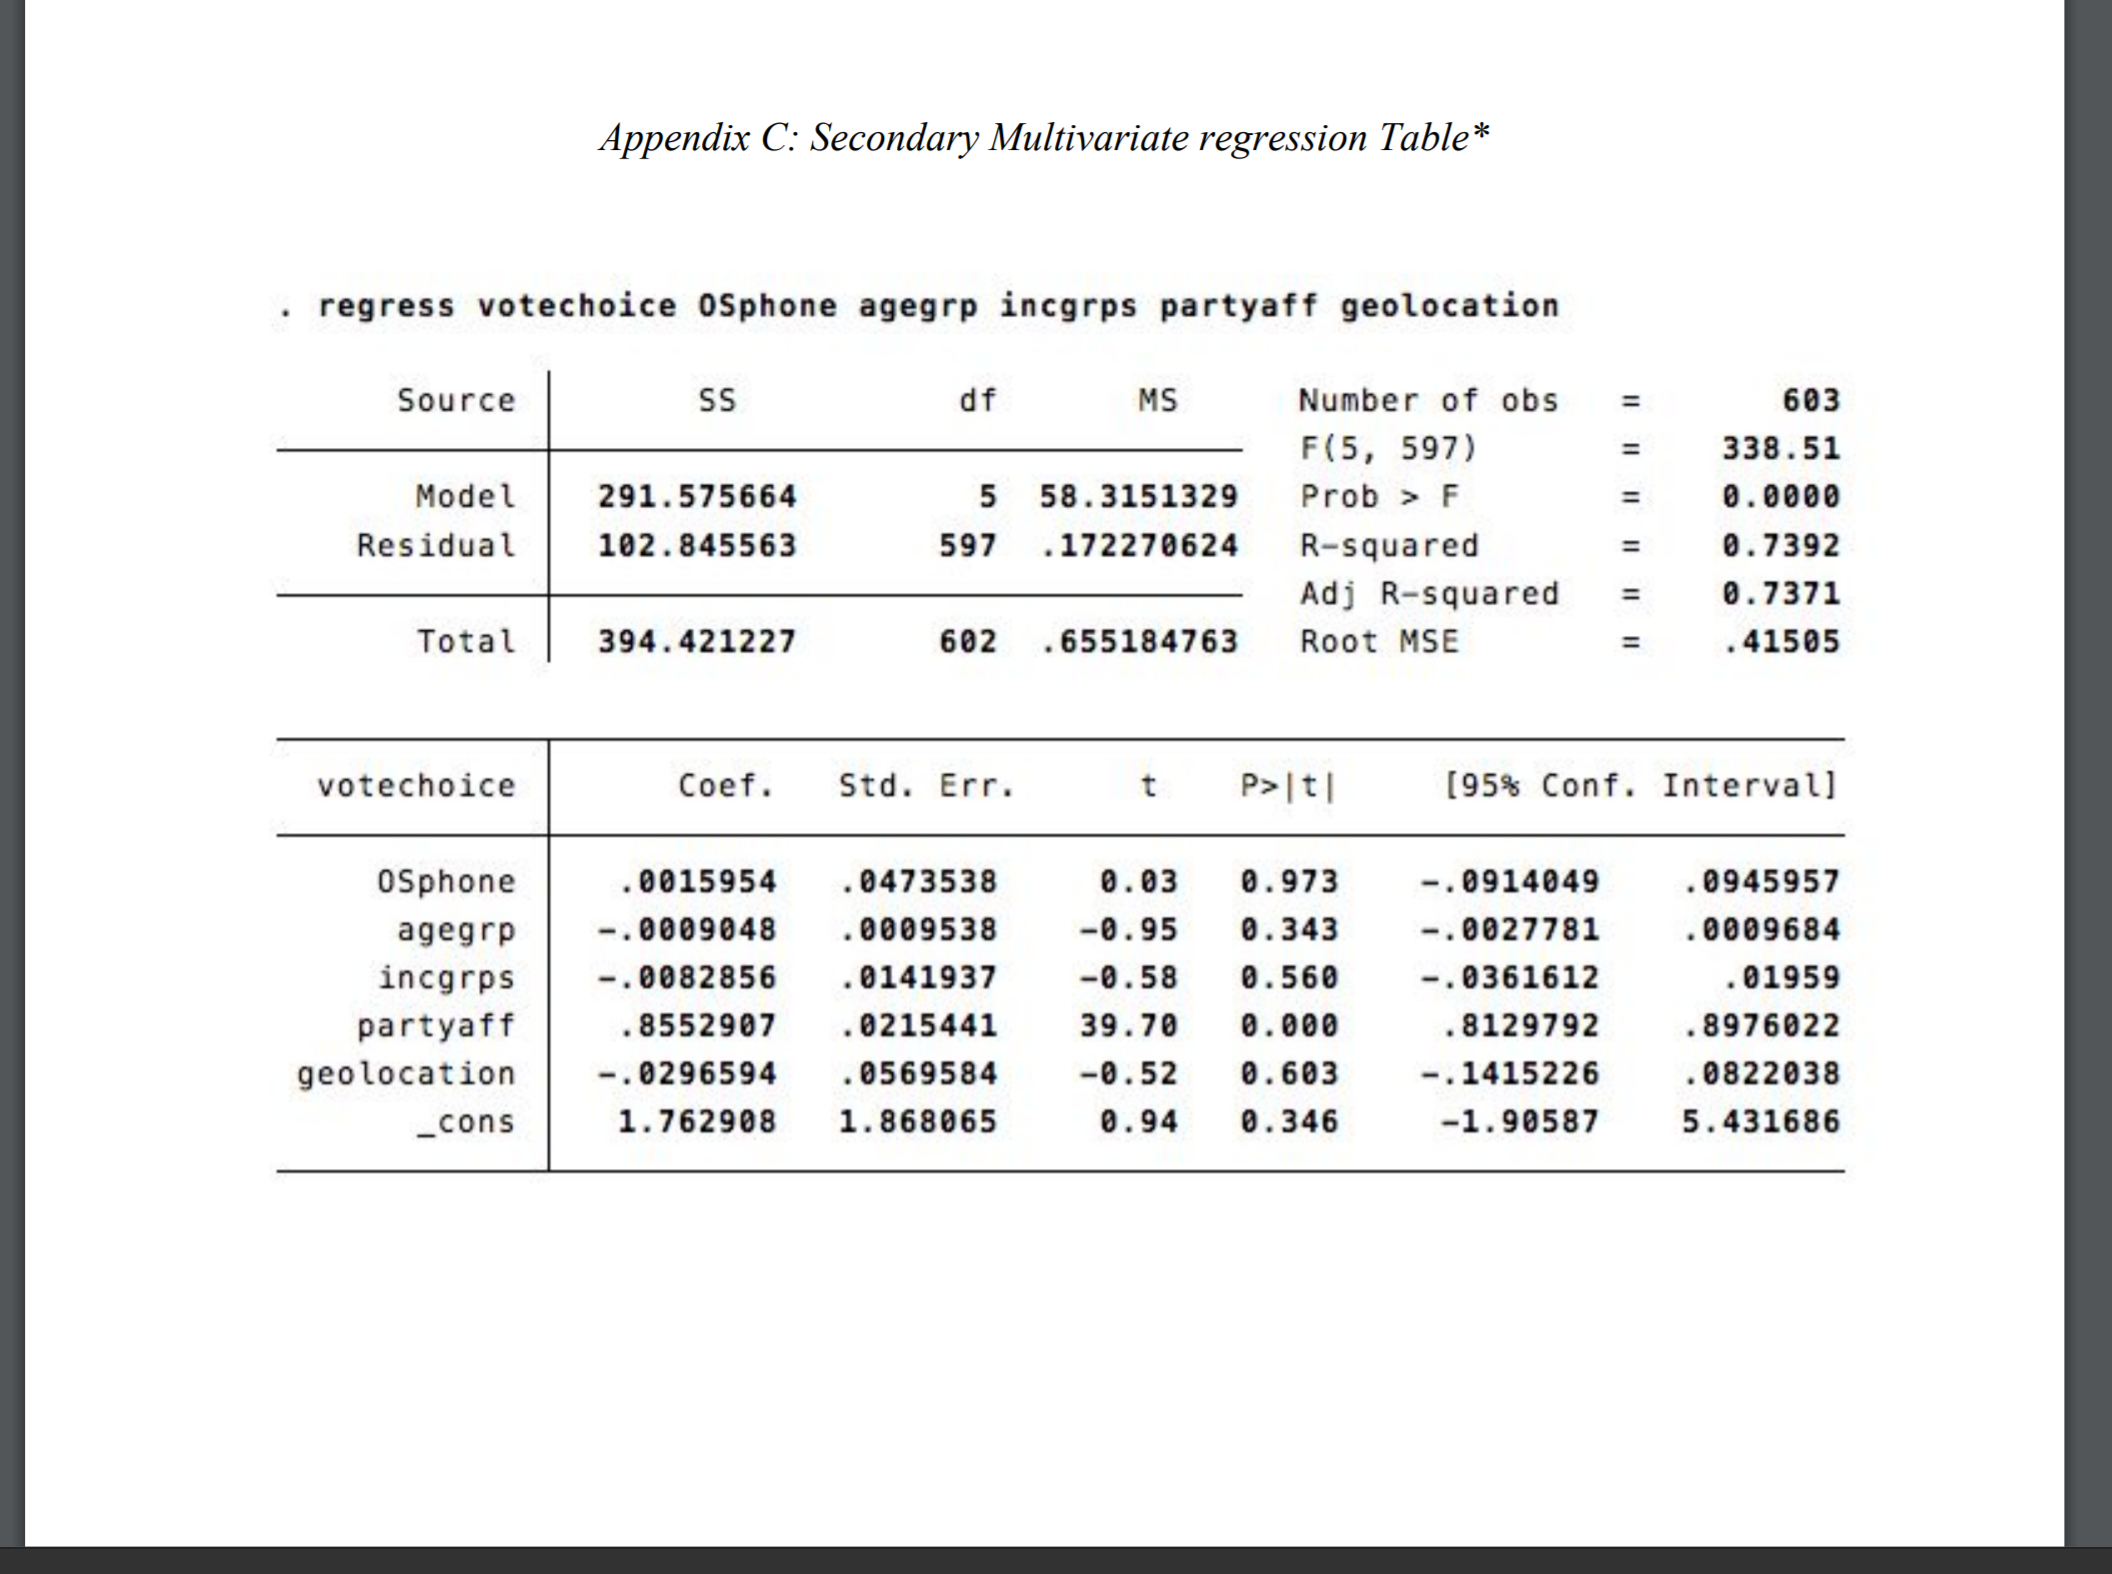 In my last iteration of the report after adding several more variables, the results became statistically insignificant. Nonetheless, there was a general trend that Canadian Apple owners tend to be more affiliated with left of center parties, more Apple owners reside in urban areas, have higher incomes, and are slightly younger, when compared to Windows or Android owners.
This was a fantastic course that really enabled me to understand how to interpret raw data and how to tell a story with numbers. The real-world applications of this are quite understated. One of the biggest challenges of the course was getting used to how to code in the Statistical Software program called Stata. By the end of the course, I was quite comfortable manipulating data sets and extracting a story behind the patterns and numbers.
After this course, it spurred my interest to dive further in data and I began to delve into using Python, and SQL.
Beyond the political science applications, this course has significant application to the world of business and market research. I will certainly use the tools I learned in this course in my future business endeavors.